
The best AI agents for data analysis depend on where the work begins, from an uploaded file or semantic model to a connected warehouse or recurring preparation workflow.
We reviewed nine options using each vendor’s current documentation and pricing to identify where each product fits.
- Prophecy: Governed data preparation and analysis for warehouse teams
- Microsoft Copilot for Power BI: Reporting teams using Microsoft semantic models
- Tableau Pulse: Leaders tracking a stable set of KPIs
- ThoughtSpot Spotter: Self-service analysis on a curated data model
- ChatGPT: Custom Python analysis from uploaded files
- PandasAI: Developer-led conversational analysis in Python
- Tellius Kaiya: Investigating why a metric changed
- Quadratic: AI-powered spreadsheet analysis with visible code
- Domo AI: Live operational monitoring, alerts, and workflows
What is an AI agent for data analysis?
An AI agent for data analysis takes a business question and carries it through data work. That work can include querying a dataset, writing Python, tracing a metric change, creating a chart, or preparing a dataset for later use.
The nine products here start from different places. Some work from a file or dataframe. Others use a semantic model, connected warehouse, operational system, or repeatable preparation workflow.
The useful question is where the agent gets its data, what it can do with that data, and what evidence it leaves behind.
How this guide was researched
This guide uses each vendor’s current product pages, documentation, help centers, and pricing pages. The review focused on four practical questions:
- Task coverage: Can the product investigate a question, create an analysis, prepare data, or trigger a useful action?
- Data context: Does it use a file, dataframe, semantic model, warehouse, or business system?
- Evidence: Can a reviewer inspect code, SQL, metric definitions, filters, workflow steps, or supporting context?
- Operational fit: What setup, permissions, pricing model, and governance work does the team need?
9 best AI agents for data analysis: Quick comparison
1. Prophecy
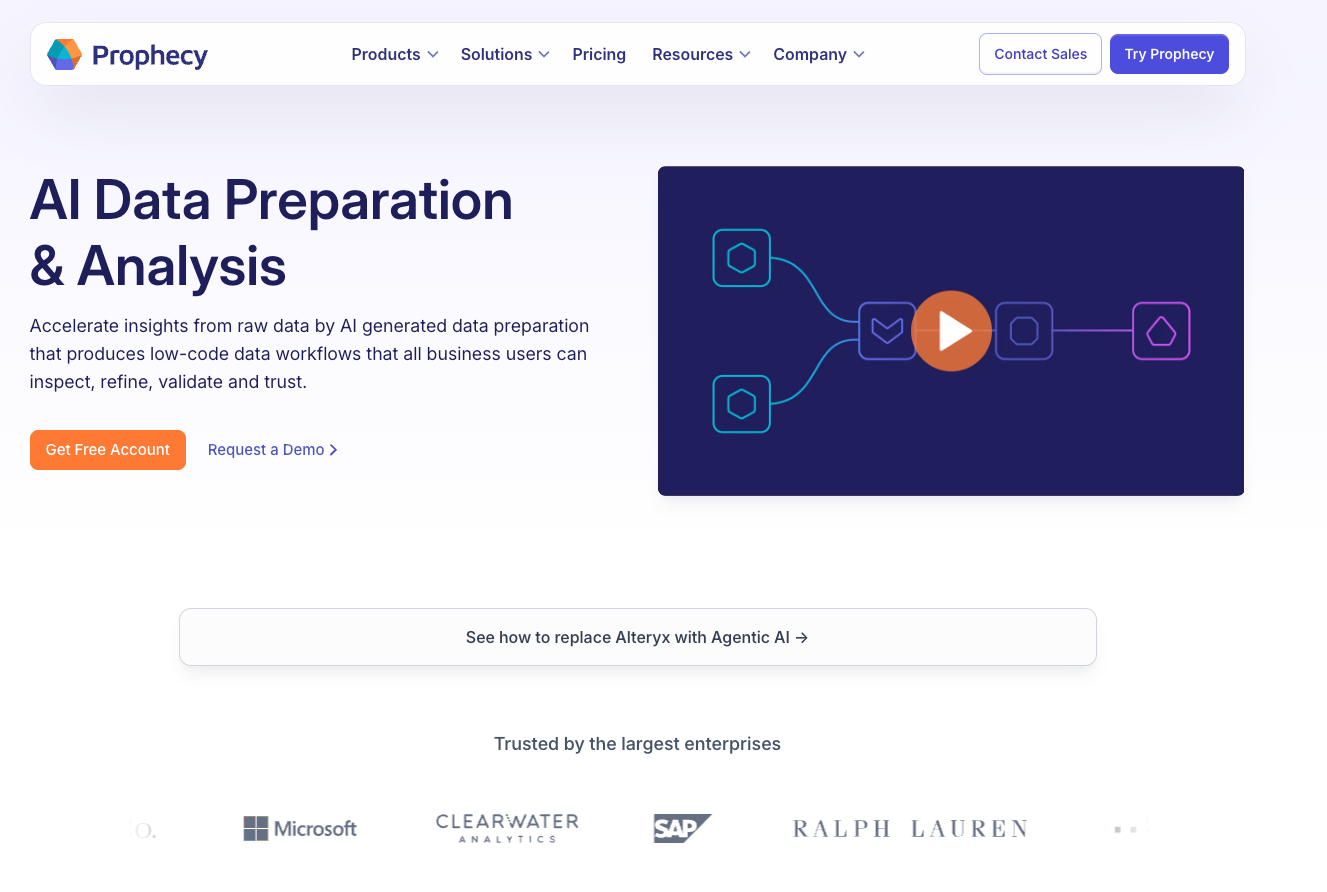
What it does: Prophecy turns a plain-English data goal into a visual preparation workflow. Business analysts can inspect, run, and refine each gem before the workflow reaches production.
Professional runs those workflows on Databricks, Snowflake, or BigQuery. Starter uses Prophecy’s embedded DuckDB environment.
Best for: Data and analytics leaders who need business analysts to prepare recurring datasets while platform teams keep control of data access, code, and production deployment.
A weekly revenue report can fall apart because a customer ID is missing, an order appears twice, or an upstream join changes. Prophecy handles that work before anyone asks an AI assistant for a chart. An analyst can describe the dataset, then inspect the joins, checks, and logic that shape the table.
The workflow stays open from the first draft to the warehouse. Analysts can test each gem in the canvas. Platform teams can review the warehouse-native SQL and dbt project before it runs on production data.
Key features
- Transform agent turns a plain-English data goal into a visual preparation workflow for warehouse data.
- Step-by-step validation lets analysts profile each gem, or pipeline step, and check sample output, nulls, and outliers.
- Warehouse-native code compiles the workflow into a standard dbt project with SQL in the customer’s Git repository.
- Governed execution runs on Databricks, Snowflake, or BigQuery with the team’s existing data access controls.
Prophecy pros
- Professional runs workflows on the customer’s warehouse using existing access controls
- Analysts and platform teams can review the visual logic and generated SQL
- Repeatable workflows can scale and feed reports, models, and downstream AI tools
Prophecy cons
- Warehouse-native processing begins with Professional
- Starter runs in Prophecy’s embedded DuckDB environment
- A one-off spreadsheet question calls for a lighter analysis tool
Pricing
Starter is free with 20 credits per month and uses Prophecy’s embedded DuckDB environment. Professional costs $150/user/month and includes 50 monthly credits per user, with Databricks, Snowflake, and BigQuery processing.
Enterprise Express costs $4,000/month for up to 20 users, billed annually. Enterprise pricing is custom.
Bottom line
Choose Prophecy when analysts keep tracing questionable numbers back to undocumented transformation steps, or when the data engineering team is backlogged with ad-hoc requests. Its data preparation agent workflow gives analysts and platform teams a shared record of how the production dataset was built.
2. Microsoft Copilot for Power BI
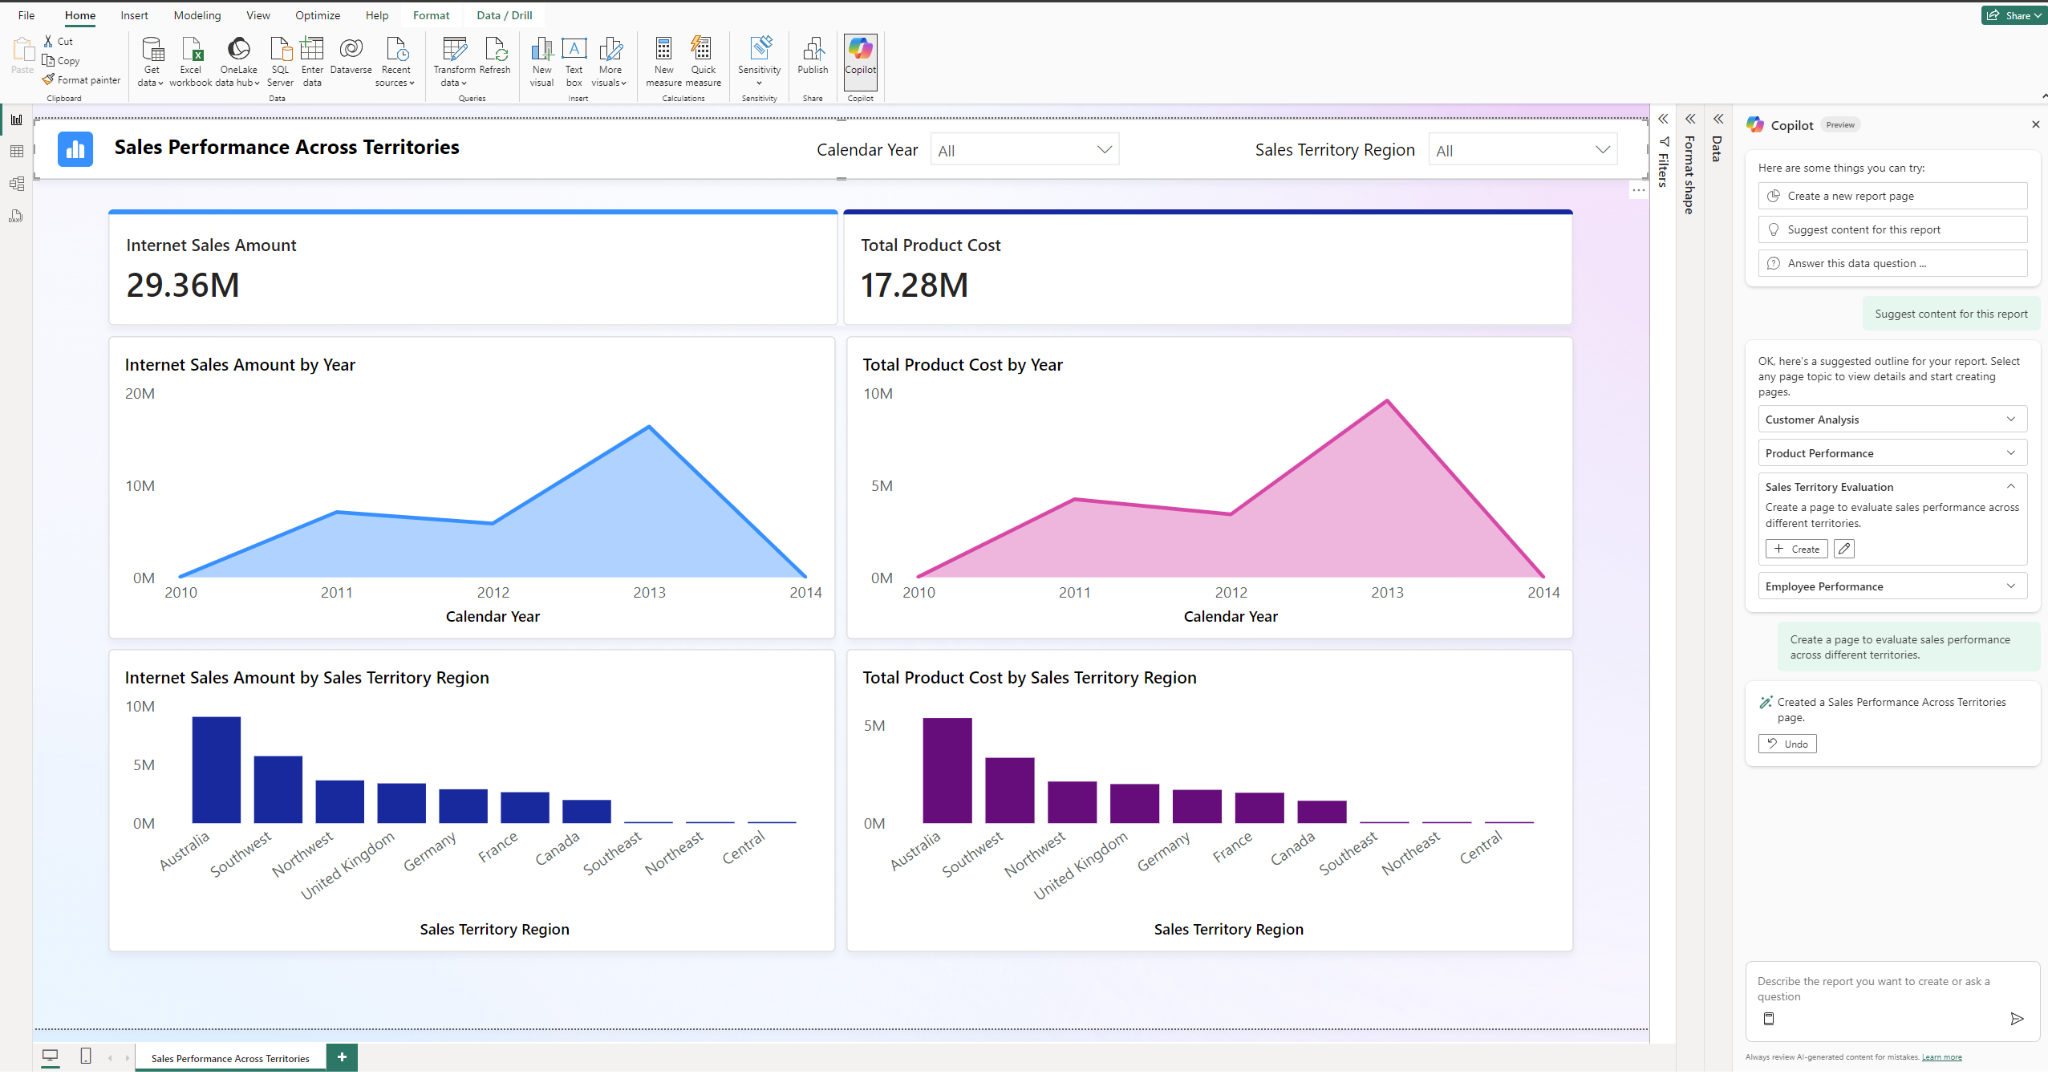
What it does: Microsoft Copilot for Power BI works from reports and semantic models. It summarizes report content, answers data questions, drafts DAX queries, creates report pages, and helps model authors improve existing models.
Best for: Teams that already run shared reporting through Power BI and have paid Fabric or Power BI Premium capacity.
Power BI Copilot gets its useful context from the semantic model behind a report. A finance leader opening a margin report sees answers grounded in the measures, relationships, and descriptions that report authors have already created.
That setup shapes the result. Shared metric definitions give business users a faster route through follow-up analysis. Inconsistent names or weak model relationships carry confusion into the answer.
Key features
- Semantic model grounding uses the measures, relationships, descriptions, and business terms defined in Power BI.
- The report Copilot pane summarizes an open report and answers questions about its content.
- Verified answers let app authors prepare responses for common questions inside Power BI apps; this remains in preview.
- Web modeling support helps authors review model structure and DAX; this experience remains in preview.
- The standalone Copilot experience searches accessible reports and semantic models in a full-screen interface; this also remains in preview.
Power BI Copilot pros
- Teams can ask questions inside the Power BI reports they already use
- Business users, report authors, and model owners can all use Copilot in their own workflow
- A prepared semantic model carries shared business definitions into the answer
Power BI Copilot cons
- Copilot requires Fabric F2 or higher, or Power BI Premium P1 or higher
- Tenant settings, region support, and model preparation affect access
- Microsoft says questions outside the semantic model can draw on general LLM knowledge
Pricing
Power BI Free supports report creation. Pro costs $14/user/month and Premium Per User costs $24/user/month, billed annually. Copilot requires Fabric F2 capacity or higher, or Power BI Premium P1 capacity or higher. A Pro or Premium Per User license alone does not activate Copilot.
Bottom line
Power BI Copilot helps when sales, finance, and operations keep returning to the same reports with follow-up questions. A clear semantic model lets people explore familiar numbers without sending every request to the BI team.
Different KPI logic across departments creates different answers, even with Copilot. Clean up that shared reporting layer before giving the chat experience to a wider group.
3. Tableau Pulse
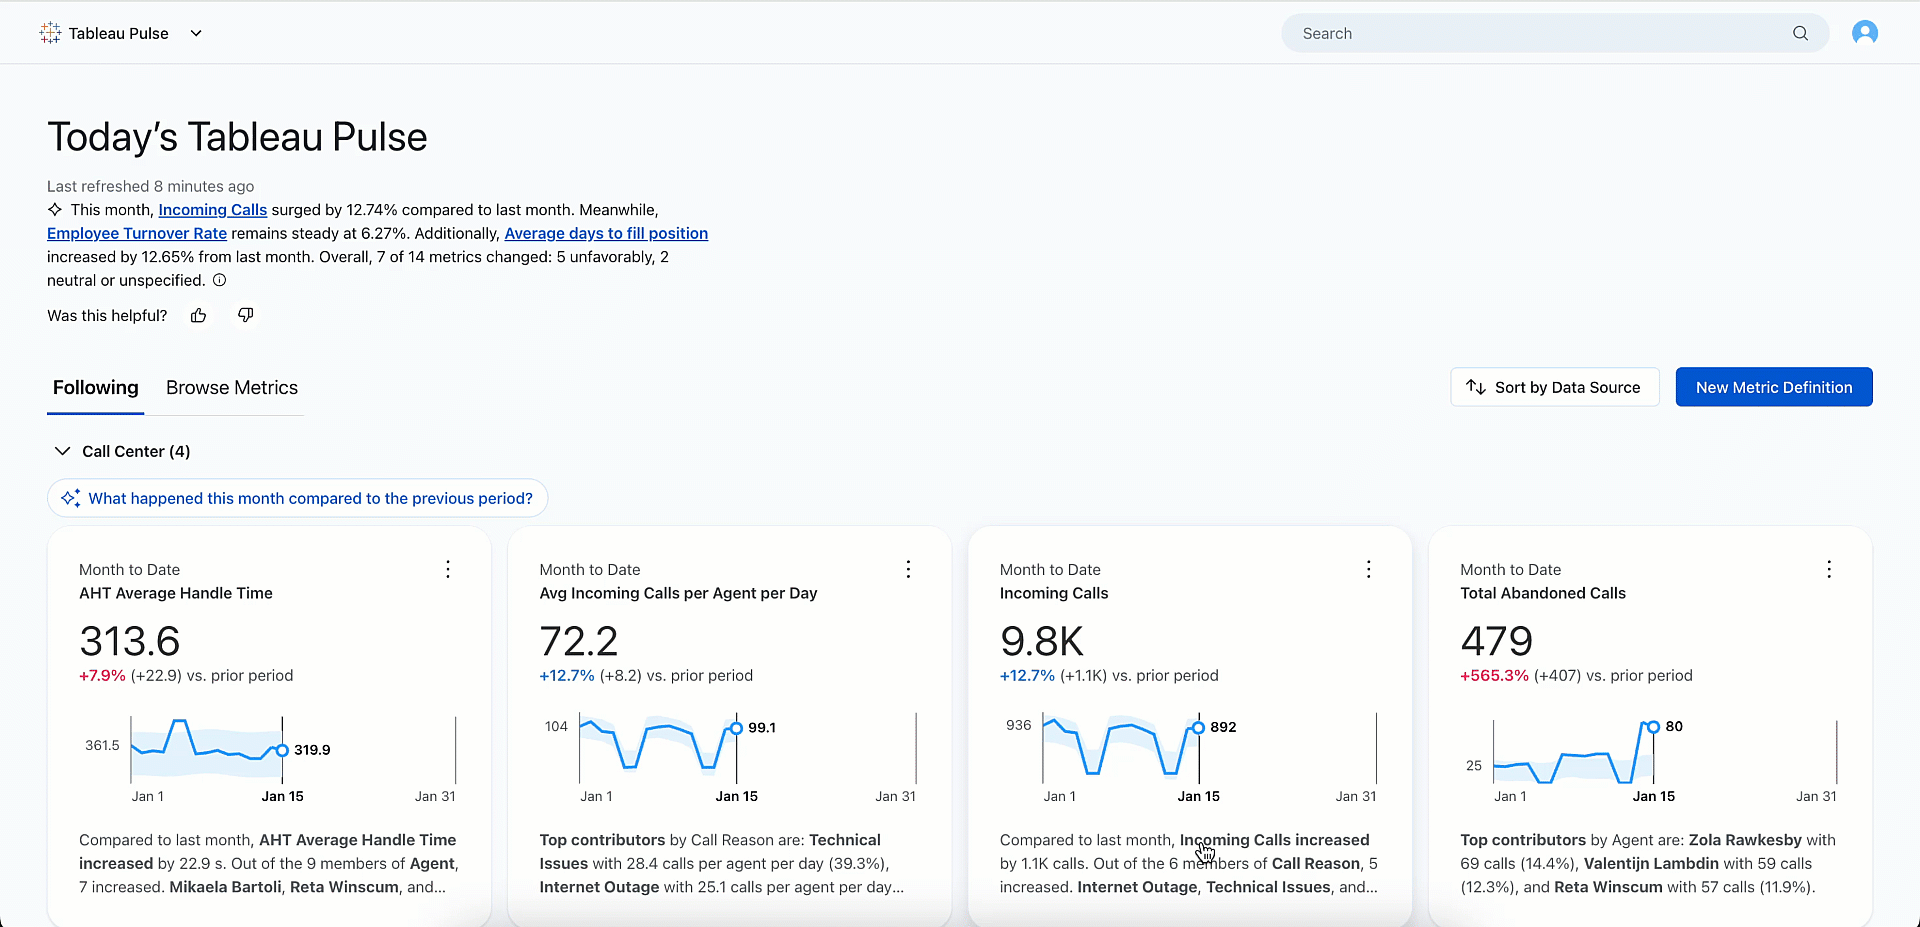
What it does: Tableau Pulse follows the metrics people choose and sends personalized updates on meaningful changes, drivers, trends, and outliers. Updates can reach Slack, Teams, email, and Tableau Mobile.
Best for: Leaders who track a stable set of KPIs and want the context behind a change before the next dashboard review.
Pulse works like an ongoing briefing for the metrics a leader follows. It sends relevant movement and supporting context during the week, covering KPIs such as revenue, pipeline, and churn in Slack, Teams, email, or Tableau Mobile.
Tableau’s metrics layer gives each metric a shared business definition across finance, sales, and operations. Tableau+ adds Enhanced Q&A, which connects multiple metrics with explanations, supporting visuals, and citations.
Key features
- Proactive insights flag drivers, trends, and outliers across followed metrics.
- The metrics layer gives each KPI a shared business definition.
- Personalized briefings reach users through Slack, Teams, email, and Tableau Mobile.
- Enhanced Q&A connects multiple metrics through explanations, supporting visuals, and citations in Tableau+.
Tableau Pulse pros
- Tableau Pulse comes with every Tableau Cloud and Embedded Analytics edition
- Leaders receive context during the week, before the next scheduled review
- Tableau+ adds deeper, cited exploration across multiple metrics
Tableau Pulse cons
- Pulse depends on well-defined metrics and reliable reporting data
- Enhanced Q&A and Tableau Agent require Tableau Cloud+ or the Tableau+ Bundle
- Its metric-first workflow leaves less room for broad, open-ended exploration
Pricing
Tableau Cloud Standard starts at $15/user/month for a Viewer license, billed annually. Each deployment needs at least one Creator license, which costs $75/user/month on Standard.
Tableau Enterprise starts at $35/user/month for a Viewer and $115/user/month for a Creator. Tableau Cloud+ and Tableau+ use custom pricing.
Bottom line
Choose Tableau Pulse when your leadership team already watches the same Tableau KPIs and needs the story behind a change during the week. Its metrics layer gives revenue, pipeline, and active customer a shared definition, then Pulse delivers each follower a useful update.
4. ThoughtSpot Spotter
What it does: ThoughtSpot gives business users a search-led analytics workspace. Its Spotter agent breaks a business question into analysis steps, tests the result, and returns an answer with traceable query logic.
Best for: Business teams that need to investigate data on a curated semantic model without waiting on an analyst for every follow-up.
A dashboard can show that renewals fell. The next job is finding the affected region, segment, product, or customer group. Spotter carries that investigation through smaller checks, then brings the findings together in a chart or written answer.
ThoughtSpot grounds the work in its semantic and context layer. The agent translates a request into governed search tokens, which lets a reviewer see how it interpreted the business question.
Key features
- Multi-step analysis breaks down a business question, tests assumptions, checks results, and reruns the analysis when needed.
- Spotter Memory applies business definitions from data models, conversations, and trusted Liveboards.
- Search tokens create traceable queries from the governed semantic layer.
- Action tools can create Jira tickets, update Salesforce opportunities, post to Slack, or trigger enterprise workflows.
ThoughtSpot Spotter pros
- Business users can investigate connected data through a search-led experience
- The semantic layer carries shared business definitions into each query
- Traceable query logic gives analysts evidence to review alongside the answer
ThoughtSpot Spotter cons
- A curated data model and clear metric definitions form part of the rollout
- Pro includes 25 Spotter queries per user each month
- Enterprise features and higher-volume use require a sales conversation
Pricing
ThoughtSpot Pro costs $50/user/month, billed annually. Usage-based Pro starts at $0.10 per credit. The Developer plan is free for one year for up to 10 users and 25 million rows.
Bottom line
Use Spotter with a well-managed semantic model and a high volume of business questions. It gives users a structured way to investigate changes across data, while analysts can review the search tokens and query logic behind each result.
5. ChatGPT
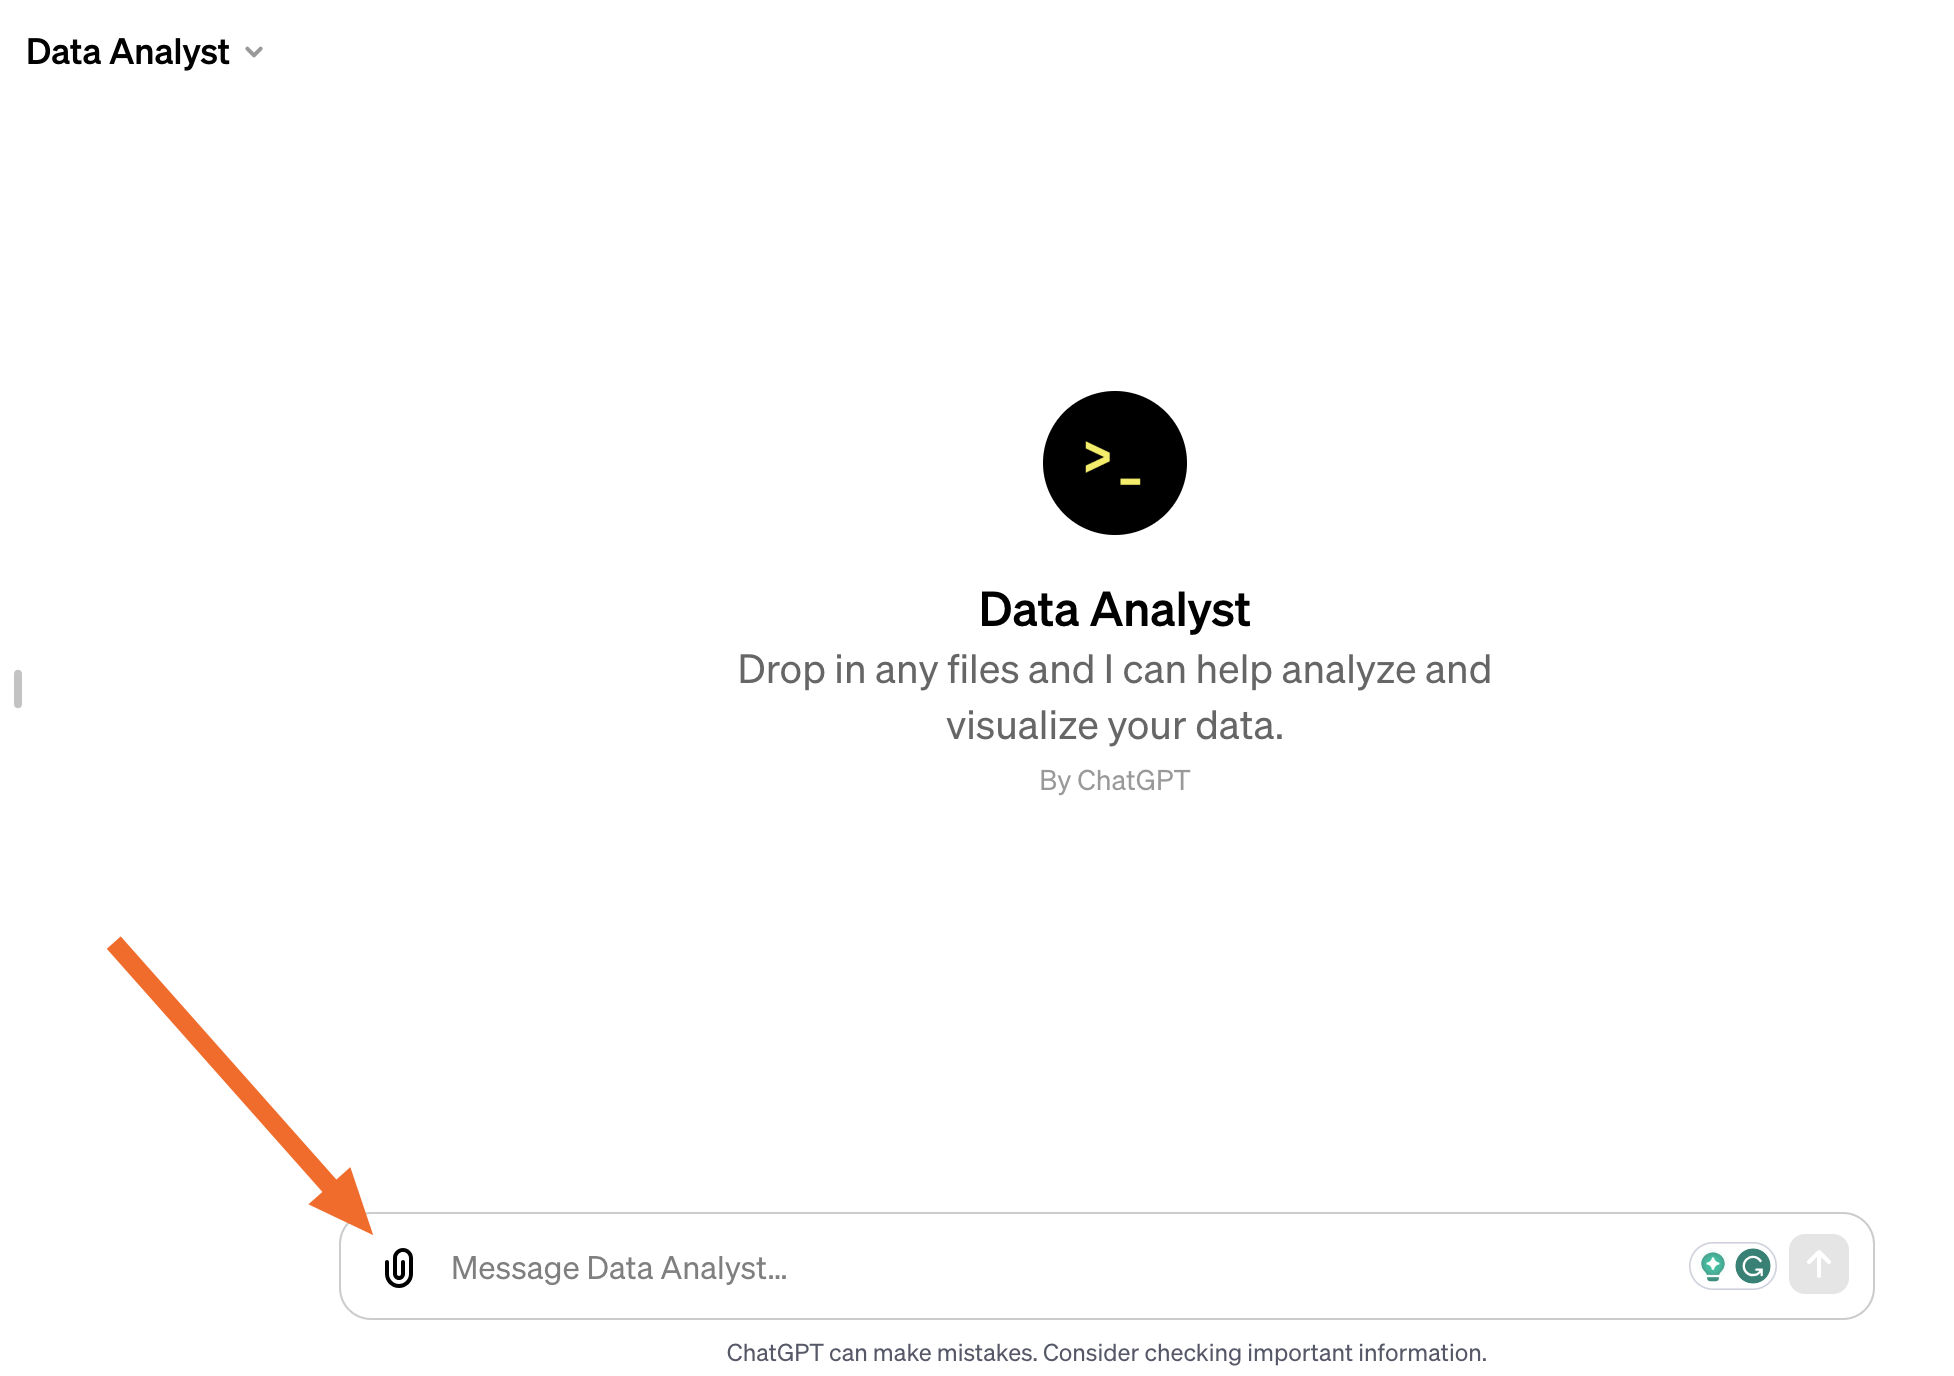
What it does: ChatGPT data analysis works from uploaded files and available connected sources. It creates tables, charts, statistics, and Python-based analysis inside the chat session.
Best for: Analysts who need a custom calculation, chart, or statistical check from a file without building a new dashboard first.
ChatGPT works well when the analysis starts with an export. An analyst can upload a sales CSV, turn it into a cohort table, test a custom calculation, and create a chart in the same session.
The file structure matters. OpenAI recommends clear column names and one record per row. ChatGPT can write and run Python for the analysis, then show the code, output, and assumptions for review.
Key features
- ChatGPT runs Python calculations, transformations, and statistical analysis against uploaded data.
- It supports CSV, XLSX, PDFs, JSON, XML, YAML, TXT, and Markdown files.
- It creates tables and charts from the analysis, including interactive bar, line, pie, and scatter charts when available.
- Available connectors let users attach files from Google Drive, OneDrive, and SharePoint.
ChatGPT pros
- An uploaded file can become a custom analysis without dashboard setup
- Generated Python gives analysts a concrete method to inspect and adjust
- The free plan includes limited data analysis and file uploads
ChatGPT cons
- Each analysis sits within a chat, project, or workspace context
- The Python environment cannot make external web requests or API calls
- Repeated reporting needs a defined owner for the file, logic, and updates
Pricing
ChatGPT Free includes limited file uploads and data analysis. Go starts at $8/month, while Plus costs $20/month. Business and Enterprise add workspace administration and security controls.
Bottom line
ChatGPT is a practical pick for a single file that needs a custom calculation or chart today. The governance review guide helps teams set a review process once those analyses start feeding shared reports or business decisions.
6. PandasAI
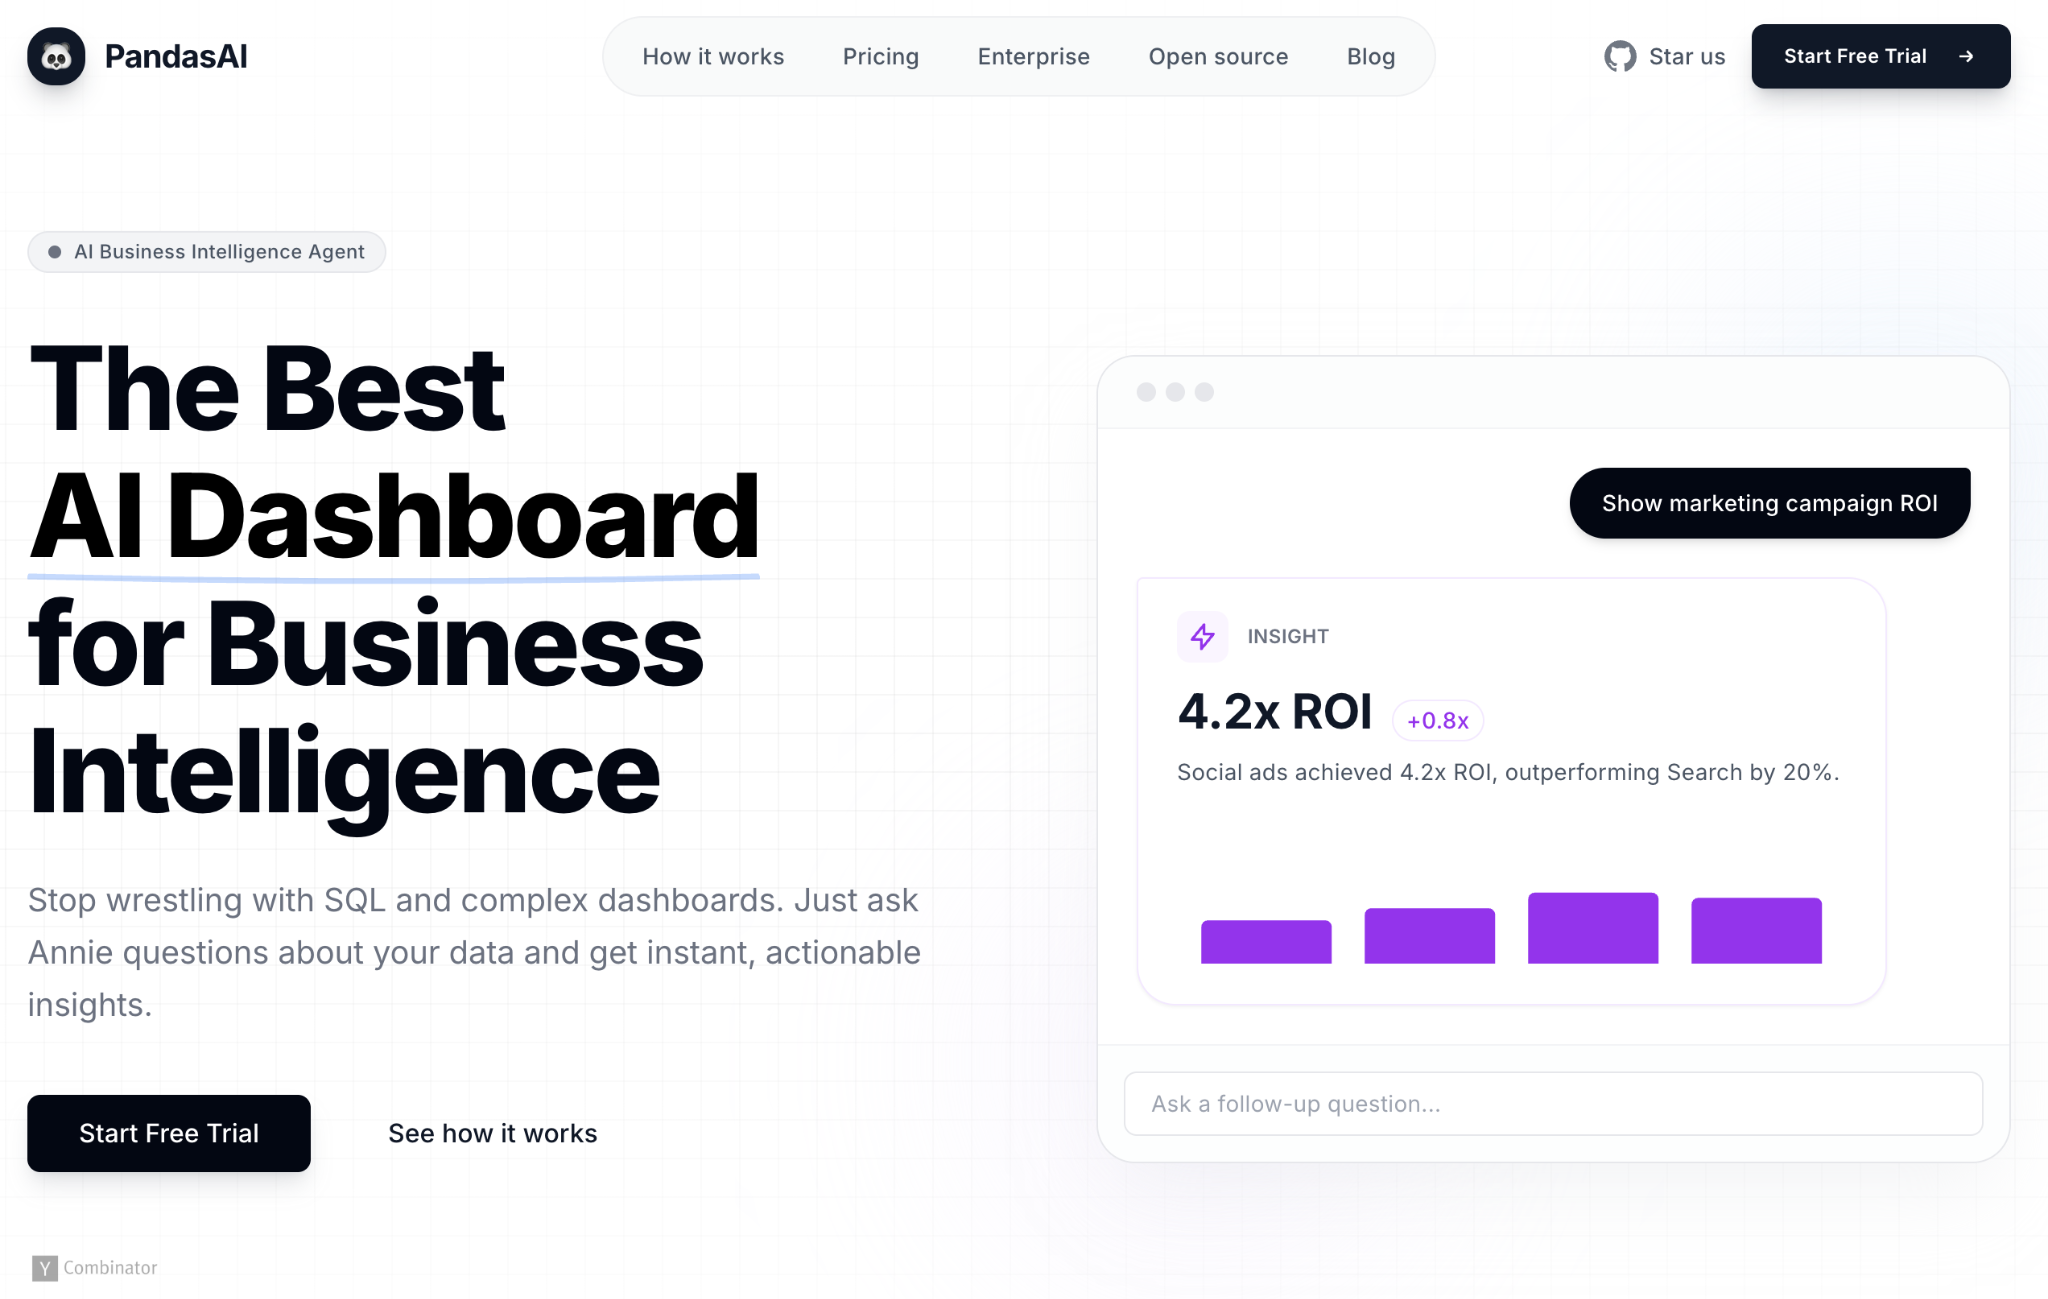
What it does: PandasAI is a Python library that turns plain-language requests into Python or SQL, then executes the generated code against a dataframe, file, or connected data source.
Best for: Developers and technical analysts who want to add conversational analysis to a Python workflow or internal data product.
PandasAI starts inside the codebase. A team connects a dataframe or database, chooses an LLM, and uses the library’s chat interface inside a notebook, application, or internal tool.
Its Natural Language Layer sends the request, table headers, and sample dataframe rows to the LLM for code generation. The generated Python or SQL runs locally. Technical teams control the runtime environment and remain responsible for model choice, logging, security, and code review.
Key features
- Natural Language Layer converts a request into Python or SQL and executes the result locally.
- Multi-turn Agent keeps conversation context for follow-up analysis.
- Docker sandbox isolates generated code from the main system during execution.
- Data connectors support CSV, XLSX, PostgreSQL, MySQL, BigQuery, Databricks, and Snowflake.
PandasAI pros
- The core library uses an MIT license
- Local code execution fits existing Python and data science workflows
- PandasAI can save LLM logs in the project for technical review
PandasAI cons
- Teams own the LLM setup, dependencies, authentication, and deployment
- Generated code still needs review before production use
- Local vector-store training requires an Enterprise license
Pricing
The MIT-licensed PandasAI core library is free. Hosted Plus costs €29.99/month (~$34.15/month) with 100 credits, while Pro costs €99.99/month (~$113.90/month) with 500 credits and BigQuery, Databricks, and Snowflake connections. Enterprise pricing is custom for self-managed production features and commercial connectors.
Bottom line
Choose PandasAI when plain-language data analysis needs to live inside an application, notebook, or internal Python tool. Your engineers control the runtime, model, connectors, logs, and sandbox, which suits teams prepared to own the code after the prompt ends.
7. Tellius Kaiya
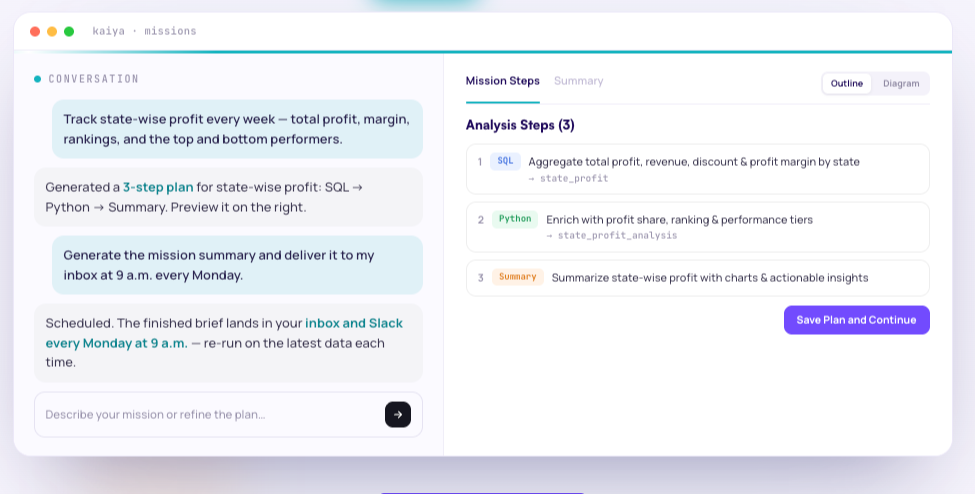
What it does: Tellius Kaiya investigates changes in connected business data through multi-step analysis. It can return visual analysis, narratives, source-traceable SQL and Python, live apps, or scheduled briefings.
Best for: RevOps, FP&A, retail, and healthcare analysts who spend a large part of the week explaining what moved in a KPI and what caused it.
A dashboard can show a revenue decline in seconds. Finding the cause often means splitting the number by region, product, customer group, or cohort, then checking each lead. Kaiya plans and runs those investigation steps across a governed Business View.
Kaiya Missions rerun an investigation on a time-based schedule. Teams can receive the latest findings as a briefing, PPTX, PDF, DOCX, or Slack update.
Key features
- Guided Insights surfaces segment drivers, cohort analysis, trend drivers, anomalies, and outliers.
- Search Query Transparency displays the SQL behind search results.
- Kaiya Deep Insights plans multi-step investigations and runs SQL and Python as needed.
- Kaiya Missions rerun analysis against fresh data and send finished briefings on a schedule.
- Agentic workflows support conversational analytics, data preparation, and no-code multistep workflows.
Tellius Kaiya pros
- Analysts get a repeatable path for root-cause analysis
- Visible SQL gives reviewers a way to inspect the logic behind a finding
- Enterprise includes Kaiya, agentic workflows, GenAI data preparation, and unlimited users and data
Tellius Kaiya cons
- Premium supports up to 10 users and 50 million live-mode rows
- Enterprise deployment, embedding, unlimited data, and unlimited users require a custom agreement
- Teams doing light dashboard reporting may use only a small part of the platform
Pricing
Tellius does not publish prices. Premium supports up to 10 users and live or pushdown queries for up to 50M rows. Kaiya, along with agentic workflows and GenAI data preparation, requires Enterprise. Enterprise supports unlimited users and data. Tellius offers a 30-day free trial.
Bottom line
Tellius works well for teams that keep reopening the same KPI after it moves. Its Guided Insights narrows the investigation to the segments, cohorts, or trends behind the change, while visible SQL gives analysts something concrete to review before the explanation goes into a meeting or report.
8. Quadratic
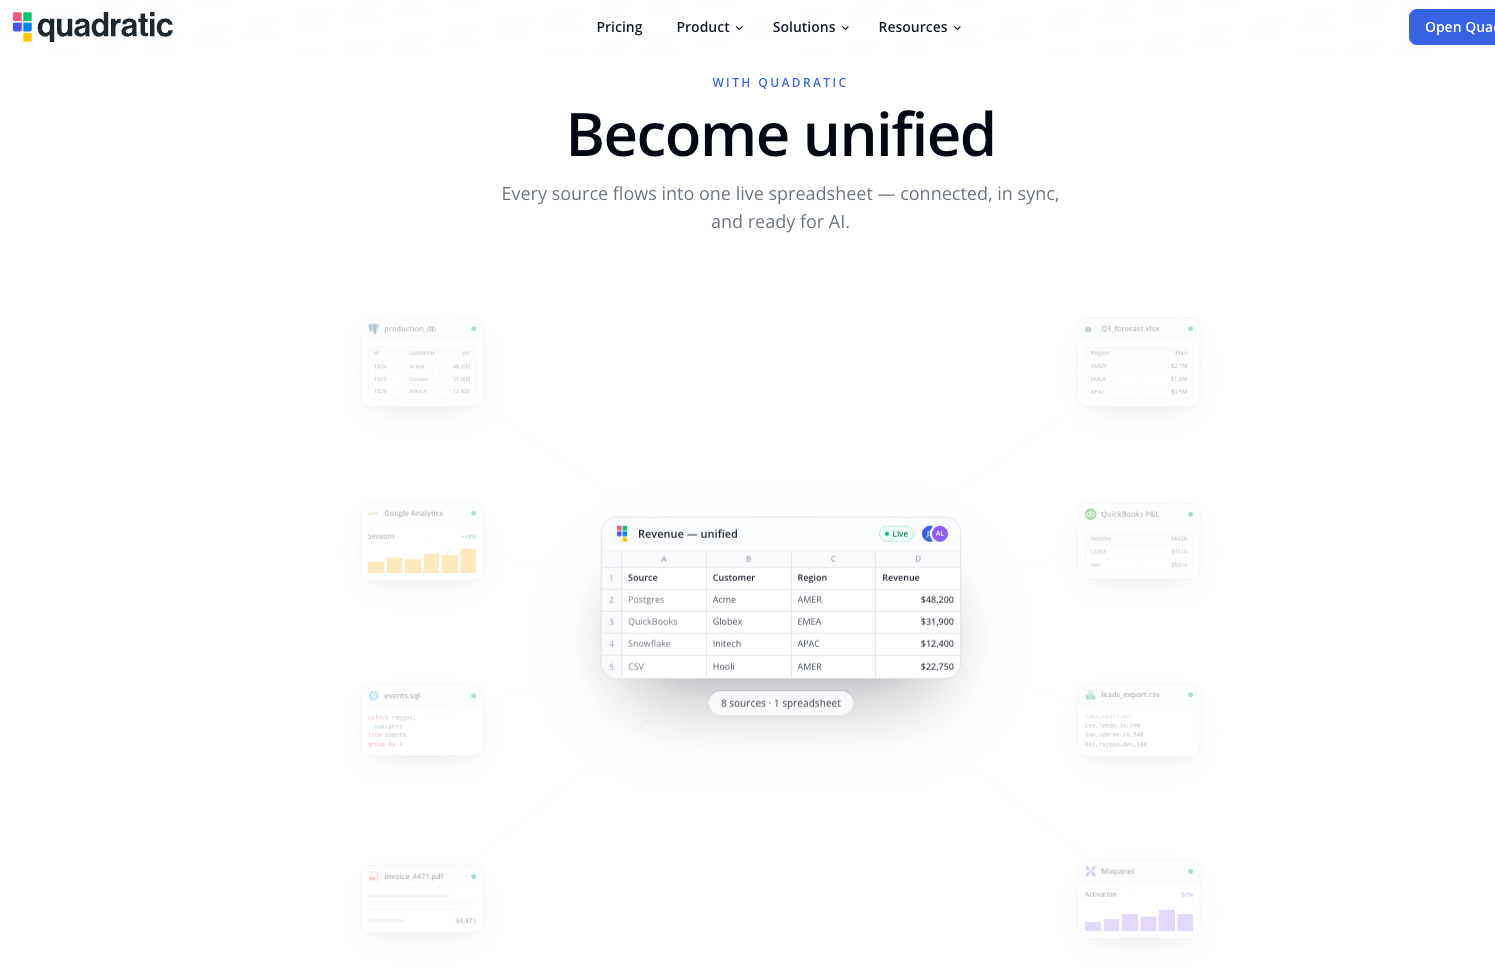
What it does: Quadratic is an AI spreadsheet for connected data analysis. It brings files, databases, formulas, Python, SQL, JavaScript, charts, and AI-generated analysis into the same grid.
Best for: Analysts and finance or BI teams who want live data and editable code inside a spreadsheet.
A finance analyst can pull a QuickBooks P&L beside a CSV forecast, use a formula for a quick check, then ask AI to write Python for a heavier calculation. The resulting code stays in the spreadsheet cell, ready for a teammate to inspect or edit.
Quadratic’s connections include PostgreSQL, Snowflake, BigQuery, QuickBooks, Google Analytics, Mixpanel, CSVs, Excel files, and PDFs. Its grid can also handle datasets up to 100 million rows, according to the product site.
Key features
- Code cells run Python, SQL, JavaScript, and spreadsheet formulas in one file.
- AI analysis writes formulas, code, charts, and explanations from plain-English requests.
- Live connections pull data from databases, files, and business tools into the spreadsheet.
- MCP access lets compatible AI agents read, write, and verify work in Quadratic. Users approve cell changes.
Quadratic pros
- Generated Python and SQL stay visible beside the output
- Connected sources support analysis that needs current data
- Pro includes unlimited sharing, files, and connections
Quadratic cons
- AI use draws from monthly credits: $20 on Pro and $40 on Business
- The free Personal plan limits AI usage, sharing, files, and connections
- SSO, self-hosting, and dedicated support sit behind custom Enterprise pricing
Pricing
Personal is free with limited AI usage, sharing, files, and connections. Pro costs $18/user/month and Business costs $36/user/month, billed annually. Enterprise uses custom pricing.
Bottom line
Quadratic works well when analysts want code-level flexibility without leaving a shared spreadsheet. Python, SQL, formulas, and results remain visible in the same grid.
Teams that need warehouse deployment, Git-based releases, or formal production controls should confirm how Quadratic fits their delivery process.
9. Domo AI
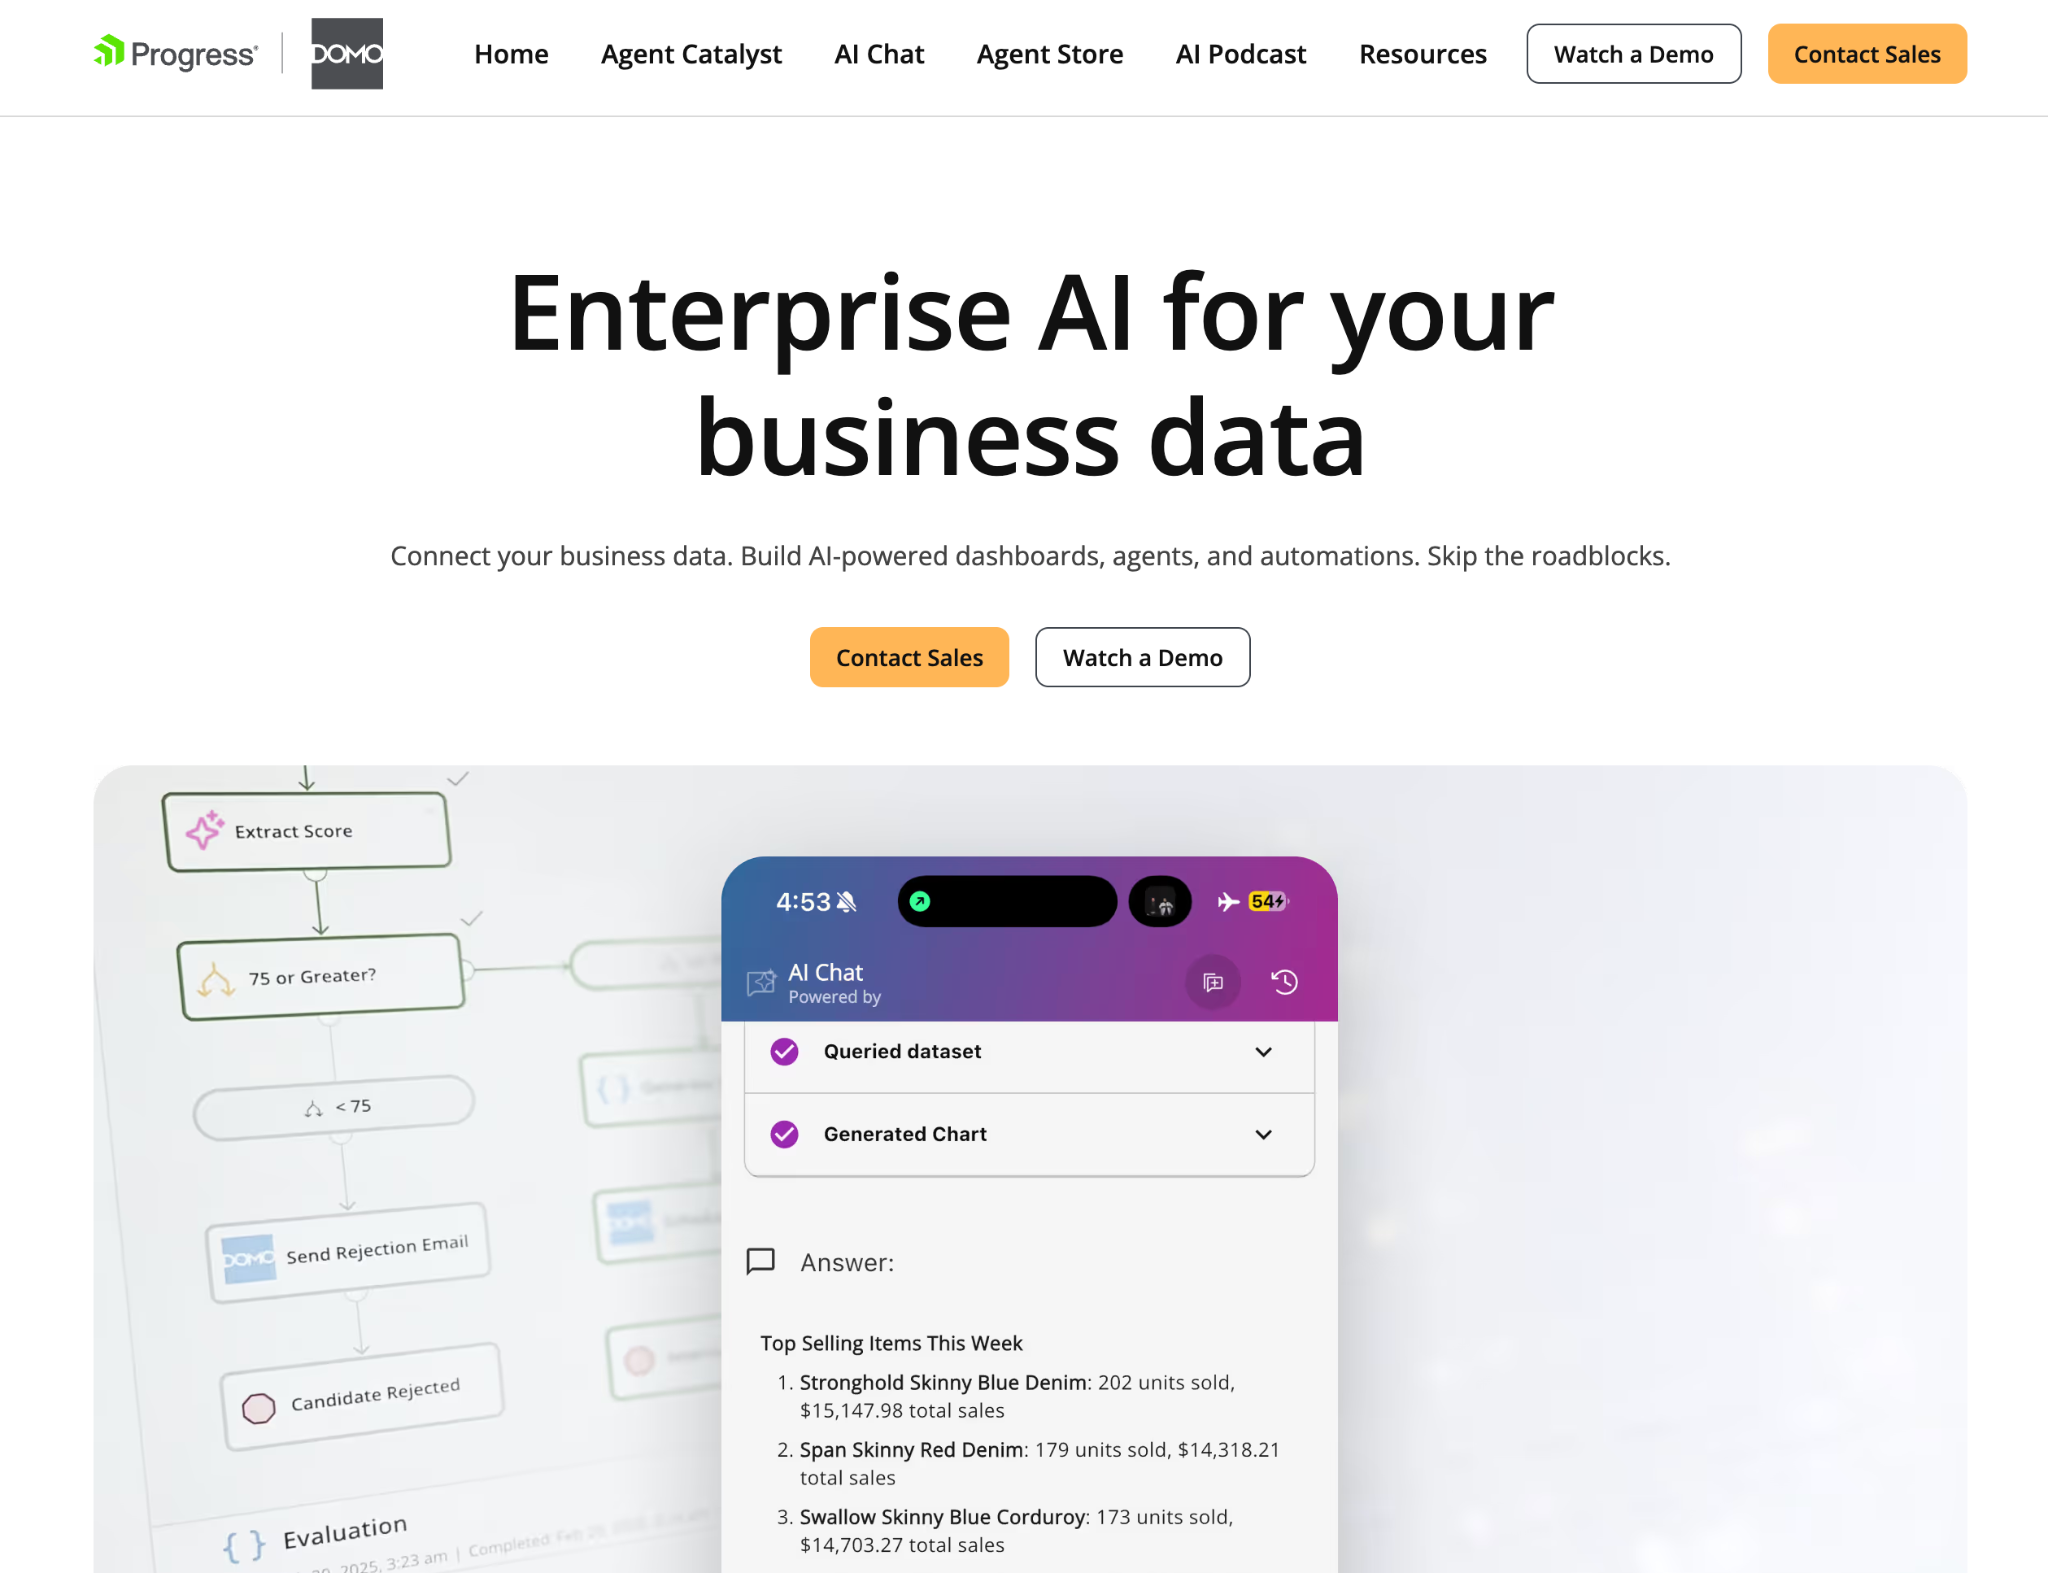
What it does: Domo AI combines connected business data, dashboards, AI Chat, custom agents, alerts, and workflow automation in one platform.
Best for: Operations and data teams that need a metric change to trigger a prompt response, such as an alert, approval, or workflow.
Domo starts with the operational moment after a number moves. Teams can connect data from business systems, monitor it through dashboards, and use agents or workflows to act on new information during the day.
Agent Catalyst gives teams a place to build, test, and deploy custom agents for work such as reporting, alerts, approvals, and business processes. AI Chat handles natural-language questions, visualizations, and recommendations from connected data.
Key features
- AI Chat answers natural-language questions and returns visualizations or recommendations from business data.
- Agent Catalyst supports custom AI agents that respond to data changes and business workflows.
- Alerts and workflows connect monitored data to notifications, approvals, and automated tasks.
- Data integration brings data from more than 1,000 sources into the platform.
- AI-assisted analysis can generate queries, calculations, forecasts, and data products.
Domo AI pros
- Agents, dashboards, integration, and workflow automation operate on the same platform
- Domo prices usage by credits, not by employee headcount or dashboard count
- A 30-day free trial requires no credit card and has no credit cap
Domo AI cons
- The trial excludes AutoML, Jupyter Workspaces, and some governance features
- Credit use depends on refresh frequency, ETL runs, storage, AI Pro usage, and workflow activity
- Teams need a realistic usage model before signing a contract
Pricing
Domo offers a 30-day free trial with unlimited users, no credit card requirement, and no credit cap. The trial excludes AutoML, Jupyter Workspaces, and some governance features.
Paid plans use custom, credit-based pricing. Usage depends on data ingestion, storage, transformations, AI activity, and workflow runs.
Bottom line
Put Domo on the shortlist when a live metric needs to lead to action during the working day. Domo gives operations teams one place to connect source data, monitor it, ask questions, and trigger a response. Model the expected refreshes, transformations, AI interactions, and workflow runs before discussing price.
Prepare the data before asking the question
Data preparation should come first when joins, records, or business logic keep producing conflicting answers. An agent can understand a definition of revenue, yet duplicate orders, stale records, and undocumented transformations still affect the result.
The choice between data preparation and last-mile analysis sets the order of an AI rollout. File and BI agents help with individual analysis tasks. Repeated source issues across dashboards, models, and teams call for a preparation workflow.
How to check an agent’s work
Check an agent’s work by tracing its answer back to the source data and logic. Products provide different forms of evidence.
- ChatGPT, PandasAI, and Quadratic expose generated Python, SQL, formulas, or editable code cells
- Power BI Copilot, Tableau Pulse, and ThoughtSpot use semantic models, metric definitions, or governed business terms
- Tellius Kaiya can expose its analysis plan, source Business View, SQL, Python, and ranked drivers
- Prophecy shows the preparation workflow, validation results, and generated SQL before deployment
- Domo connects analysis to cards, alerts, agents, and workflows; confirm SQL and query visibility during the trial
The agent workflow governance guide explains what reviewers should trace: the data source, logic, permissions, and resulting action.
Which AI agent should you choose?
Choose an AI agent based on where the work breaks down.
- Prophecy handles data preparation that must be inspected before it reaches reporting, models, or another AI tool.
- Power BI Copilot and Tableau Pulse build on established reporting. Power BI Copilot serves Microsoft semantic models; Tableau Pulse delivers regular context for selected KPIs.
- ThoughtSpot Spotter supports broad, question-led exploration on curated data. Tellius Kaiya focuses on driver analysis after a metric changes.
- ChatGPT handles one-off analysis from an uploaded file. PandasAI puts conversational analysis inside a Python application or notebook.
- Quadratic keeps AI analysis, formulas, and code in a shared spreadsheet. Domo AI connects operational data to dashboards, alerts, agents, and workflows.
Final verdict
The best AI agent for data analysis depends on the work behind the prompt. Power BI Copilot, Tableau Pulse, ThoughtSpot, Tellius Kaiya, and Domo AI extend established analytics or operations environments.
ChatGPT, PandasAI, and Quadratic give users a direct route from data to code or a working analysis. Prophecy prepares the data and logic that later analysis depends on. A chart inherits every join, filter, and transformation that produced it.
Give business teams a governed path to production
Prophecy is built for data and analytics leaders who want business analysts to own recurring data preparation under platform-team controls.
If small dataset requests keep moving between analysts and engineers, bring the team together for a demo. Include the analyst who understands the business rules and the platform owner responsible for production.
Request a demo to see how Prophecy fits the way your team divides and governs data work.
FAQs
1. Can AI agents do data analysis?
Yes. AI agents can query data, write code, create charts, explain changes, and prepare datasets. The result depends on the data source, business context, and review controls available to the agent.
2. Can an AI agent generate SQL I can trust?
Yes. An AI agent can generate reviewable SQL, but a person still needs to validate the sources, joins, filters, and metric definitions. Visible SQL gives analysts evidence to check before the result affects a forecast, budget, or operational decision.
3. What is the difference between an AI agent and a BI copilot?
The main difference is scope of work. A BI copilot works from reports or semantic models already in place. An AI agent can also carry a question through data preparation, code execution, follow-up analysis, or workflow action.
4. Do I need clean data before using an AI agent for analysis?
Yes, you need reliable data before using an AI-generated result for a business decision. Some agents can help prepare that data by checking joins, freshness, duplicate records, and business logic before analysis begins.
5. Which AI agent is best for enterprise data analysis?
The best AI agent for enterprise data analysis depends on the workflow. ThoughtSpot fits broad self-service analysis on curated data, Power BI Copilot fits Microsoft reporting, Tellius fits root-cause investigation, and Prophecy fits governed data preparation and analysis across Databricks, Snowflake, or BigQuery.