
Data observability helps you spot unusual behavior across pipelines and datasets, while data quality checks whether the data itself meets the rules your business depends on. A wrong number is harder to catch than a late table, especially when the pipeline reports no failures.
This guide to data observability vs. data quality shows where each approach is strongest, which failures need both, and how teams can combine them without duplicating work.
Data observability vs. data quality: Quick answer
The main difference between data observability and data quality is that data quality evaluates whether data meets defined expectations, while data observability monitors how data and pipelines behave across the system.
Data quality works from rules you already know. Data observability flags changes nobody wrote a rule for. Most teams use both, because known rule violations and unexpected operational failures need different controls.
Key difference: Data quality judges the data itself, while data observability watches the systems that produce it.
Data observability vs. data quality: At a glance
| Aspect | Data quality | Data observability |
|---|---|---|
| Definition | Data meets defined standards | Data and pipelines behave normally |
| Main question | Is the data correct and fit for use? | Is the data system behaving normally? |
| Primary focus | Values, records, and business rules | Pipelines, tables, dependencies, and behavior |
| Typical approach | Rules, tests, thresholds, validation | Baselines, anomaly detection, monitoring |
| Best at catching | Known defects and rule violations | Unexpected changes and operational failures |
| Timing | Before or after data is produced | Continuously in production |
| When to use | A business rule defines “correct” | Behavior can change without a rule |
| Common example | Nulls, duplicates, invalid values | Late tables, schema drift, volume drops |
| Resolution | Correct or reject bad data | Find where and why behavior changed |
| Common signals | Field values | Metadata, lineage, freshness, volume, distribution |
| Key difference | Judges the data itself | Watches the system around the data |
The biggest blind spot appears when the pipeline behaves normally, but the meaning is wrong. Null spikes can trigger both observability and quality checks, while a flawed business definition may pass every operational monitor and still distort the final analysis.
What is data quality?
Data quality is the degree to which data is accurate, complete, consistent, valid, unique, and current enough for its intended use.
It starts with business expectations, and each one becomes a rule, test, or threshold that the data either passes or fails.
What is data observability?
Data observability is the practice of monitoring data and pipelines in production to detect unexpected changes in freshness, volume, schema, distribution, and lineage.
Instead of testing against a fixed rule, observability builds a picture of normal behavior. If a table that normally receives 2M rows drops to 600K overnight, observability can flag the change even when no test says what the row count should be.
6 major differences between data observability and data quality
Data quality checks whether data meets known standards for accuracy, completeness, consistency, and business meaning, while data observability watches for unexpected changes in the systems and pipelines that produce that data.
1. Data values versus system behavior
Data quality focuses on what is inside the dataset. It checks the actual IDs, dates, amounts, categories, and relationships in each record against expected rules.
Data observability focuses more on how the dataset and its surrounding systems behave. It watches whether tables arrive on time, row volumes change, schemas move, or dependencies start failing.
A duplicate customer_id is a data quality problem because the record itself breaks a rule. A customer table arriving four hours late is an observability problem because the delivery process behaved differently from expected.
2. Defined rules versus unexpected anomalies
Data quality works from rules you already know. A customer ID cannot be null, a currency code must come from an approved list, and revenue must follow a defined accounting rule.
Data observability looks for behavior you did not explicitly define as wrong. If a table normally receives 2M rows and drops to 600K overnight, observability can flag the change even when no test says what the row count should be.
In short, quality asks, “Did the data break a known rule?” Observability asks, “Did something behave differently from normal?”
3. Point-in-time checks versus continuous behavior
Data quality often checks whether a dataset is correct at a specific stage or moment. A test might confirm that an orders table contains no duplicate IDs before it moves downstream.
Data observability follows how that data behaves over time and across the pipeline. It can show that the same orders table arrived late, lost 40% of its normal rows, and fed several downstream models before the issue surfaced.
Quality tells you whether the data passed a standard. Observability gives you the timeline and context around how the problem developed.
4. Deep business validation versus broad system coverage
Data quality can go deep into business-specific logic. A rule might check whether revenue reconciles with finance, whether an account belongs in the right segment, or whether a status value is allowed.
Data observability tends to cover more of the production environment at once, watching tables, pipelines, dependencies, and downstream consumers for unusual changes.
If finance says a revenue number is wrong, a quality check can confirm which business rule failed. Observability can help show when the problem started and which downstream assets were affected.
5. Fixing bad data versus tracing why it happened
Data quality is concerned with correcting the bad result. You might deduplicate records, fix a mapping, reject an invalid value, or standardize a field.
Data observability is more useful for tracing the failure back to its source. Lineage, freshness, volume, and dependency signals can help narrow down where the problem began and what it affected.
That investigation becomes harder when transformation logic is scattered across scripts and spreadsheets. Making pipeline logic easier to inspect visually helps teams follow a questionable value through each transformation and find the step where it changed.
6. Record contents versus operational signals
Data quality often examines the records themselves. It checks the actual IDs, dates, amounts, categories, and relationships against expected rules.
Data observability relies more heavily on signals about the dataset and pipeline, such as freshness, volume, schema, distribution, and lineage.
A freshness monitor can tell you that daily_orders arrived six hours late. A quality check can tell you that an order amount is invalid or that the wrong currency conversion was applied.
The two views answer different questions: quality tells you whether the data is trustworthy, while observability tells you whether its production environment is behaving normally.
What data observability and data quality each catch
Data quality catches problems with the data itself, while observability is stronger at spotting unexpected changes in how data and pipelines behave. Some failures fall neatly into one category, while others show why teams need both.
Here’s how common failures map to each discipline:
| Failure | Data quality | Data observability | Why |
|---|---|---|---|
| Missing required customer ID | ✓ | Possible | A completeness rule catches it directly |
| Wrong currency conversion | ✓ | Possible | The value can look normal while breaking business logic |
| Duplicate customer IDs | ✓ | Possible | A uniqueness rule catches known duplicates |
| Table arrives six hours late | Possible | ✓ | Freshness monitoring catches the delay, and a timeliness rule catches it if one exists |
| Source schema changes | Possible | ✓ | Schema monitoring flags the structural change |
| Row count drops 60% overnight | Possible | ✓ | Volume monitoring spots the unexpected drop |
| Join doubles revenue | ✓ | ✓ | Reconciliation catches the bad result, while observability may flag the volume change |
| New status disappears from a report | ✓ | ✓ | A business rule can catch the missing category, while observability may spot the distribution change |
The hardest incidents tend to sit in the overlap. The pipeline keeps running, yet a transformation changes the meaning of the output. Quality checks help prove the result is wrong, while observability gives you more context for tracing how it happened.
Data testing connects quality rules to the pipeline
Data testing turns known quality expectations into checks that run with the pipeline, while observability watches production for behavior your tests did not predict.
In the data observability vs. data quality picture, testing is the link between the two, and data quality supplies the standards behind those tests. Here’s how the three pieces fit together:
| Discipline | Role |
|---|---|
| Data quality | Defines what trustworthy data should look like |
| Data testing | Enforces known rules before or during execution |
| Data observability | Detects unexpected behavior across production systems |
Testing works best when business expectations become checks the pipeline can run consistently.
Common tests include:
- Null checks
- Uniqueness rules
- Accepted values
- Referential integrity
- Reconciliation checks
For a real example, see how common checks catch missing fields, blank values, and bad formats in loan tape data.
When to use data quality vs. data observability
Most critical datasets call for both, but each one earns its place in different situations.
Use data quality when
- A business rule defines what “correct” means, such as accepted currency codes or unique customer IDs
- Finance or compliance teams need reconciled, defensible numbers
- You need to correct or reject bad records before they move downstream
Use data observability when
- Pipelines run automatically, and a failure could go unnoticed until a report breaks
- Arrival time, volume, or schema changes without a rule describing the change
- You need lineage and dependency context to trace an incident across downstream assets
How data observability and data quality work together
Data quality and observability work together by combining explicit rules about what should be true with monitoring for changes nobody predicted. Quality gives you the standards, while observability helps you see when production starts behaving differently around them.
Here’s a five-step way to put both into practice:
1. Identify your critical data paths
Start with the tables, workflows, dashboards, models, and AI outputs tied to important decisions.
A finance dataset feeding month-end reporting deserves more attention than an unused staging table. Prioritizing critical paths keeps monitoring focused where a failure would have the largest impact.
2. Define explicit quality rules
Write down the conditions that must stay true for those datasets: required fields, accepted values, reconciliation totals, freshness targets, and unique identifiers.
If you need a broader approach to ownership and governance, build the data quality framework around those rules.
3. Establish normal operational baselines
Observability needs a picture of normal behavior before it can spot an unusual one.
Track signals such as arrival time, row volume, schema, distribution, and dependencies. A table that normally lands by 6 a.m. and suddenly arrives at noon deserves attention even if its values still pass quality checks.
4. Assign owners and escalation paths
An alert becomes useful when someone has the authority and context to act on it.
The owner should be able to answer:
- Is the change expected?
- Who fixes it?
- Who validates the result?
- Which downstream teams need to know?
Clear ownership prevents an alert from becoming another message everyone sees and nobody owns.
5. Connect testing, monitoring, and remediation
Tests catch known violations, while observability surfaces unexpected changes. The final piece is a clear path to inspect the workflow, correct the transformation, validate the output, and put the fixed version back into production.
Once pipelines run automatically, recovery matters as much as detection.
Trace data issues to their source with Prophecy
Data observability vs. data quality tells you what kind of check caught the problem, and Prophecy helps business analysts trace a failed quality check or an observability alert back to the step that caused it.
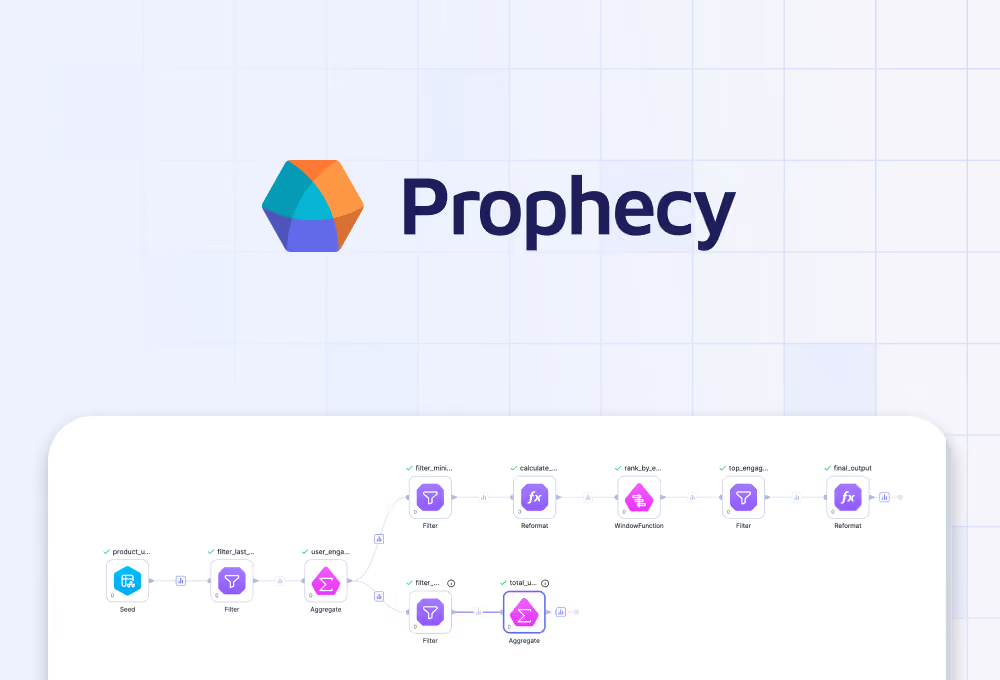
Analysts describe a goal in plain English, and Prophecy, an AI data prep and analysis platform, generates a visual workflow built from gems, the individual steps of the pipeline. Run the workflow up to any gem and profile its output, so a filter that drops a new status value or a step that changes the row count can surface before anything ships.
The workflow deploys as warehouse-native SQL on Databricks, Snowflake, or BigQuery in your Git repository. Engineers read the same logic in the Code view, and your observability tools keep watching production.
{{cta}}
Frequently asked questions
What are the five pillars of data observability?
The five commonly cited pillars of data observability are freshness, volume, schema, distribution, and lineage. Together, they help teams see whether data is arriving on time, changing unexpectedly, or affecting downstream systems.
What are the 5 pillars of data quality?
Five common data quality dimensions are accuracy, completeness, consistency, validity, and timeliness. Many frameworks also include uniqueness, which is why some teams use six dimensions.
What are the 5 Cs of data quality?
There is no single universally accepted set of 5 C’s for data quality. Different frameworks use different terms, while most modern data quality programs focus on dimensions such as accuracy, completeness, consistency, validity, timeliness, and uniqueness.
Are data quality and data integrity the same thing?
No. Data quality measures whether data is accurate, complete, consistent, valid, and useful for its purpose, while data integrity focuses on keeping data correct and consistent as it is stored, moved, and changed.
Which should you implement first, data quality or data observability?
Start with data quality rules for the datasets and business decisions you already know are critical, then add observability to catch unexpected changes across production pipelines. Teams with complex data estates may need both from the start because known rule violations and unexpected operational failures require different controls.